Whether you are the Marketing Manager, Business Manager, the Head of Admission, COO or the Headmaster / Headmistress, understanding the demographics of your students, (current and future) should be very important. Many multi-million dollar decisions are made by the Board of the school, and they would expect under good due diligence, that these future decisions should be based on facts , data and education statistics.
Many Independent schools around Australia are having a prosperous time in what has been a steady economic environment since the GFC. Many schools are full, with a good future enrollment list, giving a good deal of confidence. Irrespective of the current outlook, schools still need to be as efficient as they can be, and making decisions for the long term future in many cases.
Most schools are asset rich, with land now worth a fortune, especially in the inner city schools of Melbourne and Sydney. Strong enrollments and the market accepting regular fee increases have allowed many schools to invest in their assets, which benefits all concerned.
So how is the next round of investment and marketing decisions to be made by you and the school board?
Understanding your school’s environment
The first thing I believe schools need to understand is the school demographics, and where are the students coming from, and how can we understand this in demographic terms? If we know where they are coming from, and know of areas that offer many potential students for the future, what steps can we make to be sure we attract them to our school?
We can map the students addresses and understand this in terms of demographics (family income, age profiles, ethnicity etc), and we can also clearly understand what is our market share in any area – our number of students compared to
the total number available in a specific area.
The Census of Population and Housing is the most accurate picture of the population we have, done every 5 years at a cost of around $430M. The Census breaks Australia down into around 53,000 SA1 areas, each having a population of between roughly 400 and 800 persons. The Census asks the following questions that give us a really accurate base of what students come from each SA1:
- Age and sex of child?
- Is the child in Primary or Secondary School?
- Is the child attending:
- Government schooling
- Catholic Education
- Non-Government Education (Independent schools)
From this, for every SA1 (small area of about 400 – 800 people), we can tell how many boys / girls are going to Primary / Secondary school, and if they are in the Government, Catholic or Independent education system.
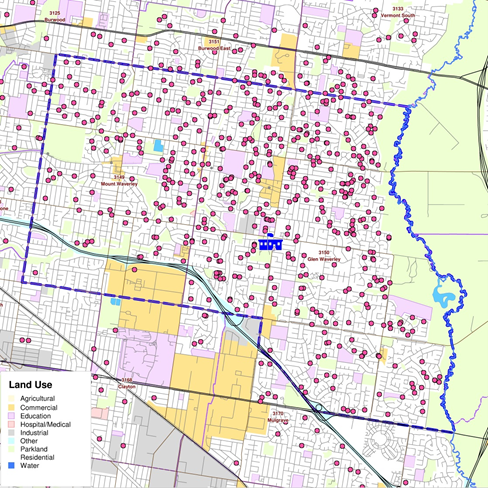
If we plot the student addresses, we can show a very accurate “market share” of how your school is performing in any area (SA1, suburb or postcode), and where your Market Area is for your school, and what other areas should be considered to market into (for potential students)?
Schools are like comets
The immediate area around a good Independent school (think head of the comet) can have upwards of 50 % market share, as living close to the school is seen by the parents as a major advantage in many cases. Travel time and simple convenience is an advantage every school has over there competition in your immediate area.
When we map this and look at the market share, schools tend to act like a comet, with the main campus generally near the head of the comet, and the tail pointing away from the Central Business District of the city you are in. We have always put this down to transport logistics, and people being able to drop their children off on the way to work. It can also be partly due to many of the best private schools in the highest economic areas, and people will always be coming in from the suburbs further out to attend those schools.
Identifying other potential marketing areas
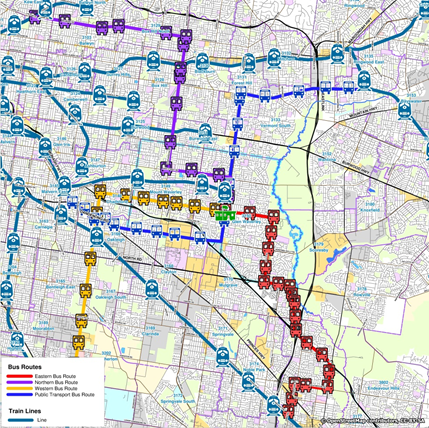
If you know the types of areas you are very strong in, you may look for similar areas to attract new students. There may be a new developing area with strong student demographics that you can access via a bus run quite easily, and you are still the closest major Independent or Catholic college to that area. Do you consider establishing the bus run while there are already a small group of potential students, with the aim to becoming a dominant player in that market? If you do analyse the surrounding areas, you may find some small adjustment to existing bus runs could place you strongly into that market initially.
Feeder schools also play a big part in that transition from Primary to Secondary school. If you have data on what are the main feeder schools for your campuses, and you can see how the numbers are changing, you may find some action is necessary. We like to map all the feeder schools for a campus, and understand this data in terms of the student and school demographics, and the other schools around that are competing for the students.
SES scores and your funding – Education Statistics
The Federal Government has not updated the data used for SES scores since the 2011 Census. If your SES score is no longer representative of the students, you could be missing out on significant funding. One Project we did for a school eventuated in them receiving just under $100K in additional funding, because they were able to show the SES score had lowered the based on their current students, and the socio economics of the areas.
Once you map the students, you can work out the current score, and see how that compares to how your current funding is assessed, and put forward a logical argument if you feel it is warranted.
Strategic decisions for the future
Schools make very large investments and need to understand the cost benefits. The types of questions we have been asked to address have included issues surrounding possible school mergers, issues around potential second campuses, issues around whether a school should have 1 or 2 ESL classes, and what years a school’s feeder school should run to before bringing all the students to the main campus.
These decisions are critical to the long term direction of a school, and should NOT be made on feelings and innuendos, when a school demographic analysis project will answer all these types of questions based on the facts and data.